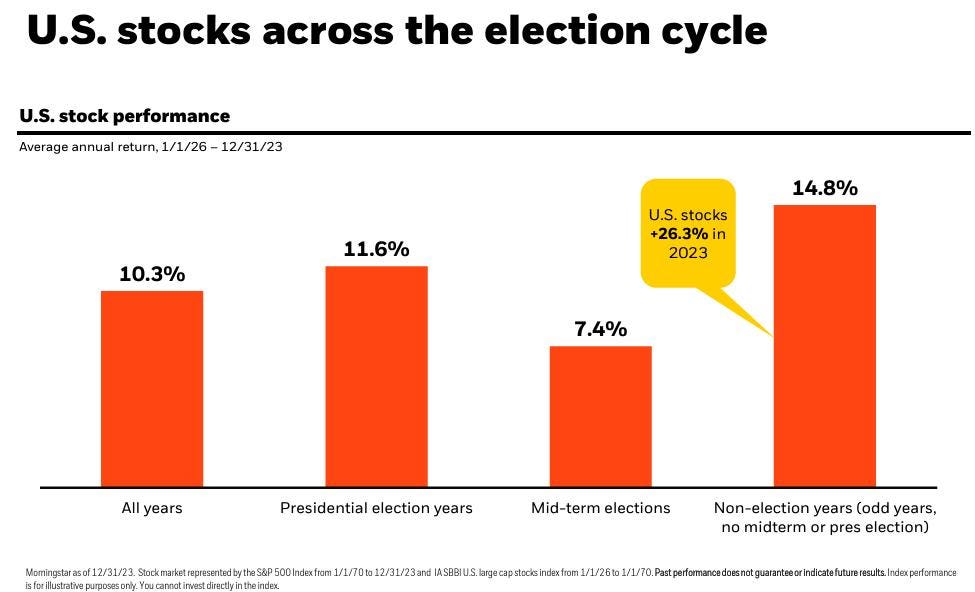
Investors shouldn’t fret about the upcoming presidential election. And they definitely shouldn’t let politics upend their long-term financial plans. Why? Because historically, financial markets have rewarded investors who stay the course. And while it may seem counterintuitive, in the past, U.S. stocks were less likely to incur losses during election years versus non-election years. These charts can help explain what investors should expect from the stock market this election cycle.
What To Expect From The S&P 500 During The Presidential Election
Besides loads of campaign ads, investors should expect increased market volatility from September to election day. But that’s no reason to panic. The U.S. stock market has gone up over time—regardless of who is running for office. And while past performance isn’t indicative of future results, investors should find comfort in the wealth of data we have about financial markets and elections.
While historically stocks did better (on average) when there wasn’t an election, years that ended with losses were far less common during an election year. According to data from BlackRock, the U.S. stock market was nearly twice as likely to experience losses during a non-election year (30% of the time) versus an election year (17%). When considering annual returns have been negative roughly 26% of the time across all years, election years don’t seem quite so scary.
What To Expect From The Stock Market After The Election
According to data from Dimensional Fund Advisors, on average, the S&P 500 performed almost 1% better during an election year compared to the year after. However—in both cases, just staying invested yielded double-digit returns. Returns during and after an election year were even slightly higher than the average returns across all years over the same period.
Again, the current administration isn’t the main driver of financial markets. Yes, the market hates uncertainty, including political ambiguity. But performance of stocks and bonds are influenced more by other factors, such as the economy, interest rates, geopolitical shocks, and the health of the broad-based financial system.
Don’t Let Political Preferences Derail Your Financial Plan
Regardless of your political preferences, there’s an abundance of evidence to suggest investors should consider leaving politics out of their portfolios. According to YCharts, a $10,000 investment in the S&P 500 back in 1950 would equal over $3 million by March 2024 (excluding dividends) for an average annual return of roughly 8%.
However, if only investing during Republican presidencies, the average annual return would sink below 3%. Only investing during Democratic terms would improve average returns to about 5%. But still nearly 3%—per year—less than staying invested during all presidencies.
What Should Investors Do To Survive The Election Cycle?
The media makes it hard to ignore the political noise, especially as the election nears. But investors shouldn’t lean into doomsday headlines, either. It’s also important to try and separate your investment portfolio from the party or person you vote for. Investments should be evaluated on their own merits, without the cloud of emotion.
And remember, the outcome of the election may have no real impact on your portfolio—even if you’re disappointed by the results.
Read the full article here


